“Above all, don't lie to yourself. The man who lies to himself and listens to his own lie comes to a point that he cannot distinguish the truth within him, or around him, and so loses all respect for himself and for others. And having no respect he ceases to love.” ― Fyodor Dostoyevsky, The Brothers Karamazov

City Forensics: Using Visual Elements to Predict Non-Visual City Attributes
To respect the power and beauty of machine learning algorithms, especially when they are applied to the visual world, let's take a look at three recent applications of learning-based "computer vision" to computer graphics. Researchers in computer graphics are known for producing truly captivating illustrations of their results, so this post is going to be very visual. Now is your chance to sit back and let the pictures do the talking.
Can you predict things simply by looking at street-view images?
Let's say you're going to visit an old-friend in a foreign country for the first time. You've never visited this country before and have no idea what kind of city/neighborhood your friend lives in. So you decide to get a sneak peak -- you enter your friend's address into Google Street View.
Most people can look at Google Street View images in a given location and estimate attributes such as "sketchy," "rural," "slum-like," "noisy" for the given neighborhood. TLDR; A person is a pretty good visual recommendation engine.

Can a computer program predict things by looking at images? If so, then these kinds of computer programs could be used to automatically generate semantic map layovers (see the crime prediction overlay from the first figure), help organize fast-growing cities (computer vision meets urban planning?), and ultimately bring about a new generation of match-making "visual recommendation engines" (a whole suite of new startups).
Before I discuss the research paper behind this idea, here are two cool things you could do (in theory) with a non-visual data prediction algorithm. There are plenty of great product ideas in this space -- just be creative.
Startup Idea #1: Avoiding sketchy areas when traveling abroad
A Personalized location recommendation engine could be used to find locations in a city that I might find interesting (techie coffee shop for entrepreneurs, a park good for frisbee) subject to my constraints (near my current location, in a low-danger area, low traffic). Below is the kind of place you want to avoid if you're looking for a coffee and a place to open up your laptop to do some work.

Startup Idea #2: Apartment Pricing and Marketing from Images
Visual recommendation engines could be used to predict the best images to represent an apartment for an Airbnb listing. It would be great if Airbnb had a filter that would let you upload videos of your apartment, and it would predict that set of static images that best depict your apartment to maximize earning potential. I'm sure that Airbnb users would pay extra for this feature if it was available for a small extra charge. The same computer vision prediction idea can be applied to home pricing on Zillow, Craigslist, and anywhere else that pictures of for-sale items are shared.

The Berkeley Computer Graphics Group has been working on predicting non-visual attributes from images, so before I describe their approach, let me discuss how Berkeley's Visual Elements relate to Deep Learning.

Deep Learning vs Mid-level Patch Discovery (Technical Discussion)
You might think that non-visual data prediction from images (if even possible) will require a deep understanding of the image and thus these approaches must be based on a recent ConvNet deep learning method. Obviously, knowing the locations and categories associated with each object in a scene could benefit any computer vision algorithm. The problem is that such general purpose CNN recognition systems aren't powerful enough to parse Google Street View images, at least not yet.
Another extreme is to train classifiers on entire images. This was initially done when researchers were using GIST, but there are just too many nuisance pixels inside a typical image, so it is better to focus your machine learning a subset of the image. But how do you choose the subset of the image to focus on?
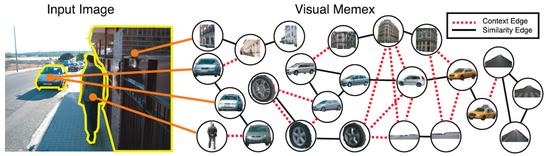
There exist computer vision algorithms that can mine a large dataset of images and automatically extract meaningful, repeatable, and detectable mid-level visual patterns. These methods are not label-based and work really well when there is an underlying theme tying together a collection of images. The set of all Google Street View Images from Paris satisfies this criterion. Large collections of random images from the internet must be labeled before they can be used to produce the kind of stellar results we all expect out of deep learning. The Berkeley Group uses visual elements automatically mined from images as the core representation. Mid-level visual patterns are simply chunks of the image which correspond to repeatable configurations -- they sometimes contain entire objects, parts of objects, and popular multiple object configurations. (See Figure below) The mid-level visual patterns form a visual dictionary which can be used to represent the set of images. Different sets of images (e.g., images from two different US cities) will have different mid-level dictionaries. These dictionaries are similar to "Visual Words" but their creation uses more SVM-like machinery.
The patch mining algorithm is known as mid-level patch discovery. You can think of mid-level patch discovery as a visually intelligent K-means clustering algorithm, but for really really large datasets. Here's a figure from the ECCV 2012 paper which introduced mid-level discriminative patches.

Unsupervised Discovery of Mid-Level Discriminative Patches. Saurabh Singh, Abhinav Gupta and Alexei A. Efros. In European Conference on Computer Vision (2012).
I should also point out that non-final layers in a pre-trained CNN could also be used for representing images, without the need to use a descriptor such as HOG. I would expect the performance to improve, so the questions is perhaps: How long until somebody publishes an awesome unsupervised CNN-based patch discovery algorithm? I'm a handful of researchers are already working on it. :-)
Related Blog Post: From feature descriptors to deep learning: 20 years of computer vision
Most people can look at Google Street View images in a given location and estimate attributes such as "sketchy," "rural," "slum-like," "noisy" for the given neighborhood. TLDR; A person is a pretty good visual recommendation engine.

Can you predict if this looks like a safe location?
(Screenshot of Street view for Manizales, Colombia on Google Earth)
Can a computer program predict things by looking at images? If so, then these kinds of computer programs could be used to automatically generate semantic map layovers (see the crime prediction overlay from the first figure), help organize fast-growing cities (computer vision meets urban planning?), and ultimately bring about a new generation of match-making "visual recommendation engines" (a whole suite of new startups).
Before I discuss the research paper behind this idea, here are two cool things you could do (in theory) with a non-visual data prediction algorithm. There are plenty of great product ideas in this space -- just be creative.
Startup Idea #1: Avoiding sketchy areas when traveling abroad
A Personalized location recommendation engine could be used to find locations in a city that I might find interesting (techie coffee shop for entrepreneurs, a park good for frisbee) subject to my constraints (near my current location, in a low-danger area, low traffic). Below is the kind of place you want to avoid if you're looking for a coffee and a place to open up your laptop to do some work.

Google Street Maps, Morumbi São Paulo: slum housing (image from geographyfieldwork.com)
Startup Idea #2: Apartment Pricing and Marketing from Images
Visual recommendation engines could be used to predict the best images to represent an apartment for an Airbnb listing. It would be great if Airbnb had a filter that would let you upload videos of your apartment, and it would predict that set of static images that best depict your apartment to maximize earning potential. I'm sure that Airbnb users would pay extra for this feature if it was available for a small extra charge. The same computer vision prediction idea can be applied to home pricing on Zillow, Craigslist, and anywhere else that pictures of for-sale items are shared.

Google image search result for "Good looking apartment". Can computer vision be used to automatically select pictures that will make your apartment listing successful on Airbnb?
Part I. City Forensics: Using Visual Elements to Predict Non-Visual City Attributes
The Berkeley Computer Graphics Group has been working on predicting non-visual attributes from images, so before I describe their approach, let me discuss how Berkeley's Visual Elements relate to Deep Learning.

Predicting Chicago Thefts from San Francisco data. Predicting Philadelphia Housing Prices from Boston data. From City Forensics paper.
Deep Learning vs Mid-level Patch Discovery (Technical Discussion)
You might think that non-visual data prediction from images (if even possible) will require a deep understanding of the image and thus these approaches must be based on a recent ConvNet deep learning method. Obviously, knowing the locations and categories associated with each object in a scene could benefit any computer vision algorithm. The problem is that such general purpose CNN recognition systems aren't powerful enough to parse Google Street View images, at least not yet.
Another extreme is to train classifiers on entire images. This was initially done when researchers were using GIST, but there are just too many nuisance pixels inside a typical image, so it is better to focus your machine learning a subset of the image. But how do you choose the subset of the image to focus on?
There exist computer vision algorithms that can mine a large dataset of images and automatically extract meaningful, repeatable, and detectable mid-level visual patterns. These methods are not label-based and work really well when there is an underlying theme tying together a collection of images. The set of all Google Street View Images from Paris satisfies this criterion. Large collections of random images from the internet must be labeled before they can be used to produce the kind of stellar results we all expect out of deep learning. The Berkeley Group uses visual elements automatically mined from images as the core representation. Mid-level visual patterns are simply chunks of the image which correspond to repeatable configurations -- they sometimes contain entire objects, parts of objects, and popular multiple object configurations. (See Figure below) The mid-level visual patterns form a visual dictionary which can be used to represent the set of images. Different sets of images (e.g., images from two different US cities) will have different mid-level dictionaries. These dictionaries are similar to "Visual Words" but their creation uses more SVM-like machinery.
The patch mining algorithm is known as mid-level patch discovery. You can think of mid-level patch discovery as a visually intelligent K-means clustering algorithm, but for really really large datasets. Here's a figure from the ECCV 2012 paper which introduced mid-level discriminative patches.

Unsupervised Discovery of Mid-Level Discriminative Patches
I should also point out that non-final layers in a pre-trained CNN could also be used for representing images, without the need to use a descriptor such as HOG. I would expect the performance to improve, so the questions is perhaps: How long until somebody publishes an awesome unsupervised CNN-based patch discovery algorithm? I'm a handful of researchers are already working on it. :-)
Related Blog Post: From feature descriptors to deep learning: 20 years of computer vision
The City Forensics paper from Berkeley tries to map the visual appearance of cities (as obtained from Google Street View Images) to non-visual data like crime statistics, housing prices and population density. The basic idea is to 1.) mine discriminative patches from images and 2.) train a predictor which can map these visual primitives to non-visual data. While the underlying technique is that of mid-level patch discovery combined with Support Vector Regression (SVR), the result is an attribute-specific distribution over GPS coordinates. Such a distribution should be appreciated for its own aesthetic value. I personally love custom data overlays.
City Forensics: Using Visual Elements to Predict Non-Visual City Attributes. Sean Arietta, Alexei A. Efros, Ravi Ramamoorthi, Maneesh Agrawala. In IEEE Transactions on Visualization and Computer Graphics (TVCG), 2014.
City Forensics: Using Visual Elements to Predict Non-Visual City Attributes. Sean Arietta, Alexei A. Efros, Ravi Ramamoorthi, Maneesh Agrawala. In IEEE Transactions on Visualization and Computer Graphics (TVCG), 2014.
Part II. The Selfie 2.0: Computer Vision as a Sidekick
Sometimes you just want the algorithm to be your sidekick. Let's talk about a new and improved method for using vision algorithms and the wisdom of the crowds to select better pictures of your face. While you might think of an improved selfie as a silly application, you do want to look "professional" in your professional photos, sexy in your "selfies" and "friendly" in your family pictures. An algorithm that helps you get the desired picture is an algorithm the whole world can get behind.

Attractiveness versus Time. From MirrorMirror Paper.
The basic idea is to collect a large video of a single person which spans different emotions, times of day, different days, or whatever condition you would like to vary. Given this video, you can use crowdsourcing to label frames based on a property like attractiveness or seriousness. Given these labeled frames, you can then train a standard HOG detector and predict one of these attributes on new data. Below if a figure which shows the 10 best shots of the child (lots of smiling and eye contact) and the worst 10 shots (bad lighting, blur, red-eye, no eye contact).

10 good shots, 10 worst shots. From MirrorMirror Paper.
You can also collect a video of yourself as you go through a sequence of different emotions, get people to label frames, and build a system which can predict an attribute such as "seriousness".

Faces ranked from Most serious to least serious. From MirrorMirror Paper.
In this work, labeling was necessary for taking better selfies. But if half of the world is taking pictures, while the other half is voting pictures up and down (or Tinder-style swiping left and right), then I think the data collection and data labeling effort won't be a big issue in years to come. Nevertheless, this is a cool way of scoring your photos. Regarding consumer applications, this is something that Google, Snapchat, and Facebook will probably integrate into their products very soon.
Mirror Mirror: Crowdsourcing Better Portraits. Jun-Yan Zhu, Aseem Agarwala, Alexei A. Efros, Eli Shechtman and Jue Wang. In ACM Transactions on Graphics (SIGGRAPH Asia), 2014.
Part III. What does it all mean? I'm ready for the cat pictures.
This final section revisits an old, simple, and powerful trick in computer vision and graphics. If you know how to compute the average of a sequence of numbers, then you'll have no problem understanding what an average image (or "mean image") is all about. And if you're read this far, don't worry, the cat picture is coming soon.
Computing average images (or "mean" images) is one of those tricks that I was introduced to very soon after I started working at CMU. Antonio Torralba, who has always had "a few more visualization tricks" up his sleeve, started computing average images (in the early 2000s) to analyze scenes as well as datasets collected as part of the LabelMe project at MIT. There's really nothing more to the basic idea beyond simply averaging a bunch of pictures.

Teaser Image from AverageExplorer paper.
Usually this kind of averaging is done informally in research, to make some throwaway graphic, or make cool web-ready renderings. It's great seeing an entire paper dedicated to a system which explores the concept of averaging even further. It took about 15 years of use until somebody was bold enough to write a paper about it. When you perform a little bit of alignment, the mean pictures look really awesome. Check out these cats!

Aligned cat images from the AverageExplorer paper.
I want one! (Both the algorithm and a Platonic cat)
The AverageExplorer paper extends simple image average with some new tricks which make the operations much more effective. I won't say much about the paper (the link is below), just take at a peek at some of the coolest mean cats I've ever seen (visualized above) or a jaw-dropping way to look at community collected landmark photos (Oxford bridge mean image visualized below).

Aligned bridges from AverageExplorer paper.
I wish Google would make all of Street View look like this.
AverageExplorer: Interactive Exploration and Alignment of Visual Data Collections. Jun-Yan Zhu, Yong Jae Lee, and Alexei A. Efros. In SIGGRAPH 2014.
Averaging images is a really powerful idea. Want to know what your magical classifier is tuned to detect? Compute the top detections and average them. Soon enough you'll have a good idea of what's going on behind the scenes.
Conclusion
Allow me to mention the mastermind that helped bring most of these vision+graphics+learning applications to life. There's an inimitable charm present in all of the works of Prof. Alyosha Efros -- a certain aesthetic that is missing from 2015's overly empirical zeitgeist. He used to be at CMU, but recently moved back to Berkeley.
Being able to summarize several of years worth of research into a single computer generated graphic can go a long way to making your work memorable and inspirational. And maybe our lives don't need that much automation. Maybe general purpose object recognition is too much? Maybe all we need is a little art? I want to leave you with a YouTube video from a recent 2015 lecture by Professor A.A. Efros titled "Making Visual Data a First-Class Citizen." If you want to hear the story in the master's own words, grab a drink and enjoy the lecture.
"Visual data is the biggest Big Data there is (Cisco projects that it will soon account for over 90% of internet traffic), but currently, the main way we can access it is via associated keywords. I will talk about some efforts towards indexing, retrieving, and mining visual data directly, without the use of keywords." ― A.A. Efros, Making Visual Data a First-Class Citizen